

When we are caring for a septic patient in the ED, we know that aggressive care with early antibiotics and ensuring adequate preload saves lives. But what do we do when we aren’t sure if more fluid will help any longer? How can we finesse our fluid management in the ED?
Historical perspective
- In 2001, Dr. Emanuel Rivers and colleagues published a landmark ED-based study in patients with severe sepsis and septic shock. They demonstrated that an early goal-directed (EGDT) strategy of sepsis management, including crystalloid boluses to target a CVP of 8-12, vasopressors for a MAP of 65 or greater, and transfusions or dobutamine if markers of perfusion were still low, improved mortality (from 46.5% to 30.5%!)1
- The patients in the EGDT arm of the Rivers trial received more fluids (5 vs 3.5L) over the first 6 hours of care than the usual care group
- Fifteen years later, PROCESS, PROMISE, and ARISE were published. These three large, international sepsis trials showed that there was no mortality difference between “usual care” today, and EGDT. However, the patients in the standard care arms of this trial were still receiving significant amounts of fluid: between 4-4.5L in the first 6 hours of their care2–5
- As our understanding of modern sepsis management continues to evolve, scientists have started to question whether a strategy of very early and very aggressive fluids is beneficial. We know that longer time to antibiotics means increased mortality6, but a recent population data study demonstrated that a longer time to fluid bolus was not associated with mortality7
- Two studies performed in Africa, both in pediatric and in adult populations, have demonstrated higher mortality rates with early fluid bolus strategies8,9. Of note, these patients had very significant differences from our typical patient populations – namely, high rates of malaria, anemia, and HIV
- Nevertheless, multiple trials are ongoing to determine whether a more restrictive fluid strategy after initial fluid bolus is beneficial for patients in septic shock10,11
Why do we give fluids?
- All of our resuscitation is directed at improving end-organ perfusion for the patient in shock
- Oxygen delivery to the patient’s tissues (D02) depends on arterial oxygen content (Ca02) and cardiac output12,13
- Cardiac output depends on three factors:
- Preload
- Afterload
- Contractility
- So, when we give a fluid bolus, it is with the assumption that the patient will benefit from increased preload, i.e., that they are situated towards the left of the Frank-Starling curve!
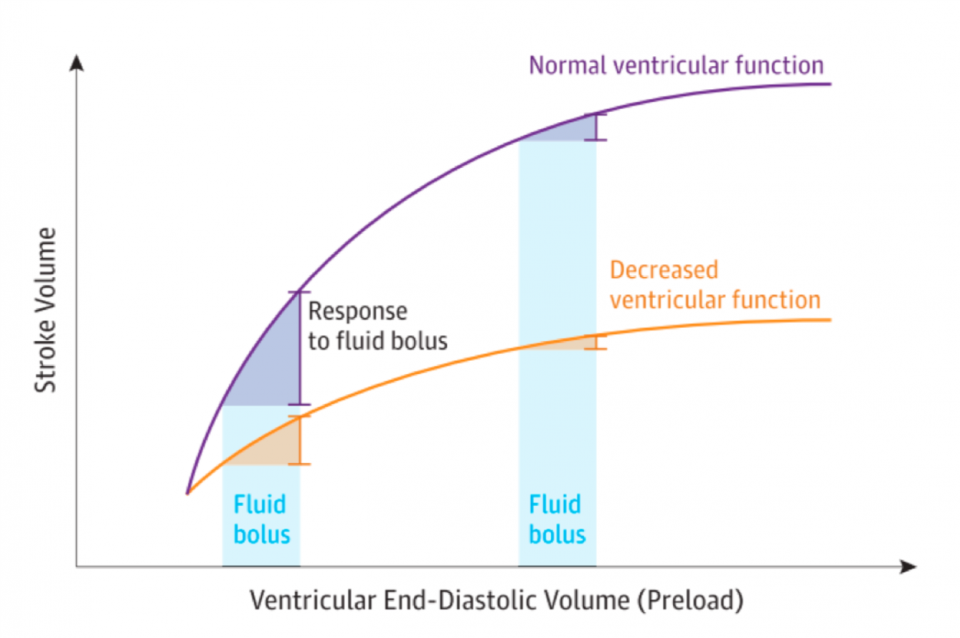
Figure 1: Frank-Starling curve, from Bentzer et al. JAMA 2016
- In the literature, patients who are “fluid responsive” will improve their cardiac output by 10-15% in response to a fluid bolus14,15
Problems with giving too much fluid
- In contrast to patients who are towards the left of the Frank-Starling curve and who will improve their cardiac output with a fluid bolus, patients on the flat portion of the curve will have diminishing returns with further fluid loading (or even worsen as a result).
- In studies of critically ill patients, we know that fluid overload results in16–20:
- Longer time on the ventilator
- Higher rates of fluid-related interventions (thoracentesis, diuresis)
- Longer hospital admission
- Higher in-hospital mortality
Current guidelines21,22
- The Surviving Sepsis Campaign recommends an initial fluid bolus of 30 mL/kg of crystalloid for patients with severe sepsis or septic shock – but they acknowledge this recommendation is based on “low quality of evidence”
- Importantly, in their recent update, the Surviving Sepsis authors recommend that after an initial bolus, providers should be reassessing volume status
Methods of assessing fluid responsiveness
- While static measurements of fluid responsiveness (CVP, PAOP, ScV02) have long been used in critical care, dynamic measurements that assess real-time changes in hemodynamics (pulse pressure variation, stroke volume variation, passive leg raise, and point of care ultrasound) are better predictors of fluid responsiveness15
- Consider the mini fluid bolus23:
- Critically ill patients were given 100 mL of crystalloid over 1 minute, with subsequent measurements of cardiac output. Those who improved their cardiac output 15% or more in response to 100 mL of fluid, were more likely to respond to a full 500 mL bolus of fluid
- While we often do not have access in the ED to the technology these investigators used to measure cardiac output (non-invasive cardiac output monitors), you could consider giving a smaller fluid bolus (250 mL) than you normally would, and stay at the bedside to decide whether your resuscitation goals are being met
- We will discuss 3 dynamic methods of assessing fluid responsiveness:
- Passive leg raise
- IVC ultrasound
- Pulse pressure variation
Passive leg raise
- Delivers approximately 300 mL of blood from the lower extremities to the right heart – it is a reversible fluid bolus!
- How to do it24,25:
- Patient should be in semi-recumbent position (head of bed at 45 degrees)
- Ensure the patient is calm and comfortable
- Next, flatten patient out and lift trunk and legs to 45 degrees (ideally, the bed should elevate the legs instead of the health care provider doing this lift)
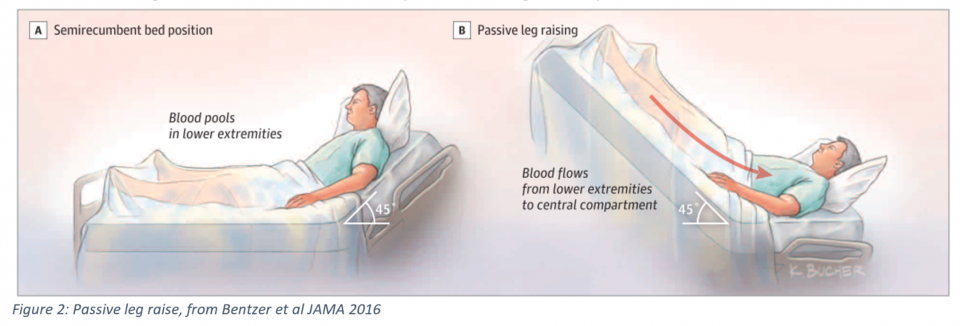
- Measure cardiac output during the passive leg raise – if the patient has a change in hemodynamics, this should occur within 60 seconds
- After the PLR, ensure that the patient’s hemodynamics return to baseline, indicating no other factors than the reversible fluid bolus you gave accounted for your findings
A positive response to a PLR (i.e. an improvement in CO by 10% or more during the PLR) is an excellent predictor of fluid responsiveness
- In the Bentzer meta-analysis, PLR had a LR+ of 11, LR- of 0.13 for fluid responsiveness14
- Studies have demonstrated that an increase in pulse pressure variation, in combination with a PLR, is predictive of fluid responsiveness26
- Blood pressure is less reliable in combination with PLR, likely due to the time it takes to get a non-invasive cuff pressure27
Bottom line: a PLR is an easy, reversible test for fluid responsiveness. Its predictive value is best when combined with some measurement of cardiac output. Lastly, although seemingly benign, a PLR is not appropriate for patients in cervical spine collars, or those with increased intra-abdominal or intracranial pressure.
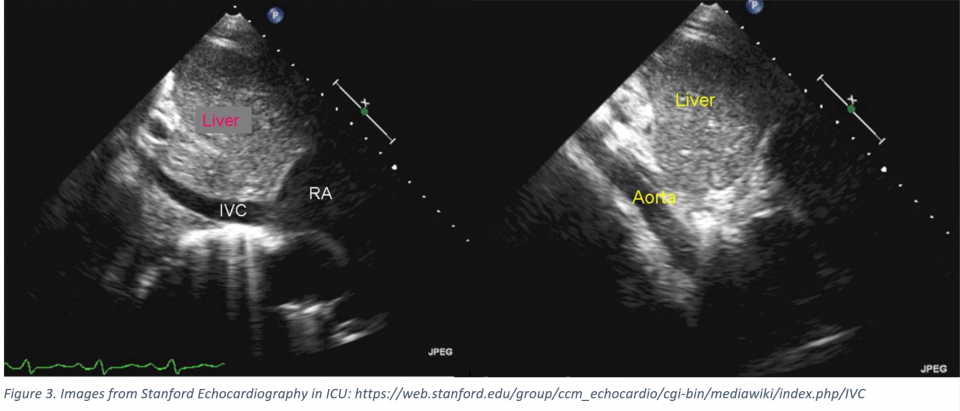
IVC ultrasound
- Use of IVC ultrasound has become popular over the past several years, as PoCUS uptake continues to increase.
- To even start to look at the IVC on PoCUS, you need to ensure:
- The patient is in sinus rhythm
- You see the cavo-atrial junction – otherwise, it is easy to confuse the IVC with the aorta (see below images)!
- You are measuring perfectly perpendicular to the IVC – most authors recommend measuring 2 cm from the cavo-atrial junction in M-mode
- IVC was initially used to approximate CVP – however, this practice has mostly been abandoned as use of CVP has also started to decline
- Some authors still advocate for the use of an absolute diameter of IVC, suggesting that if the IVC is large (> 2.5 cm), then the patient is likely full, while if it is small (1.3-1.5 cm), then the patient is more likely volume responsive28–30. However, few patients will fall into these extremes.
- Studies have also examined the use of change in IVC diameter with respiration as a test for fluid responsiveness: in theory, IVC diameter should decrease with inspiration in a patient who is spontaneously breathing, and will increase with inspiration for a patient receiving positive pressure ventilation
- We can calculate the amount of IVC collapsibility with the following index:

- In spontaneously breathing patients, there is a large amount of variation in what is considered “significant” IVC collapsibility (18-50%!)
- One meta-analysis found that a change in caliber by 40% had a LR+ of 3.5 and a LR- of 0.4-0.7 for fluid responsiveness14. However, this was based on combining two studies of < 100 patients, and prior studies have not been able to confirm an association between IVC collapsibility and fluid responsiveness31.
- Changes in IVC diameter may be more reliable in patients who are mechanically ventilated: in the same Bentzer meta-analysis, a change in IVC caliber by 25% had a LR+ of 5.3 and LR- 0.27 for completely ventilated patients14.
- Still, the most recent meta-analysis on the use of IVC for fluid responsiveness concluded that there was so much heterogeneity between studies, that the authors concluded “the diameter of the IVC and its respiratory variations does not seem to be a reliable method to predict fluid responsiveness32.”
- Bottom line: while IVC PoCUS is an easily accessible tool, there are several caveats to its use, and there is not robust, homogeneous data demonstrating it is predictive of fluid responsiveness, particularly in spontaneously breathing patients.
Pulse pressure variation15,33–35
- Pulse pressure variation (PPV) is used to approximate stroke volume variation – in essence, it assesses changes in preload due to respiration
- For PPV to be reliable, all factors other than respiration must be kept constant: the patient must be in sinus rhythm, with an arterial line in place, and fully mechanically ventilated with a tidal volume of 8 mL/kg or more
- Theory: with a positive pressure breath, inspiration will decrease RV preload and LV afterload, while increasing LV preload
- In a patient who is fluid responsive, the increase in LV preload should lead to an increase in pulse pressure with inspiration
- After the initial increase in pulse pressure, the LV preload will decrease, which usually coincides with expiration.
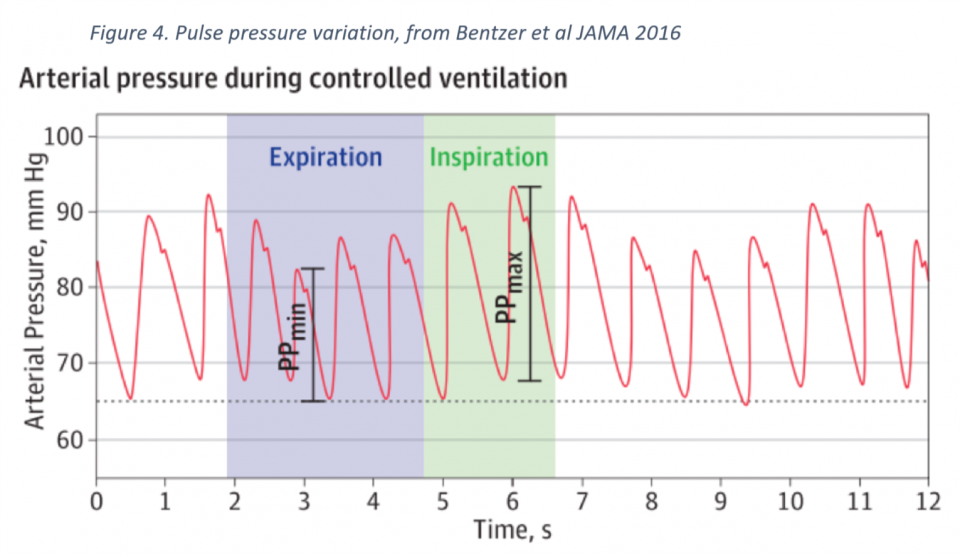
- To measure PPV:
- Change the arterial line tracing from its usual baseline of 25 mm/s, to a waveform speed of 6.25mm/s – this will make it easier to see variations in pulse pressure with respiration
- Find the maximum systolic pressure, and on the same waveform, identify both the systolic and diastolic pressures – the difference between these two is your PPmax
- Now find the minimum systolic pressure and, on the same waveform, identify the systolic and diastolic pressures – the difference between these two is your PPmin
- ACEP has an excellent explanation of PPV with pictures
- PPV of > 12% predicts fluid responsiveness quite reliably:
- Two meta-analyses have found similar LR+ of 7 and LR- of 0.12 for fluid responsiveness, in patients with PPV > 12%33,34
Summary
- Fluid is a drug, and one that we give frequently, often without thinking about the consequences
- In our sickest patients, however, extra fluid can increase morbidity and mortality – these are exactly the patients we need to be reassessing with every bolus!
- There are many ways to assess fluid responsiveness:
- Passive leg raise – most useful when assessed in combination with stroke volume assessment, or potentially pulse pressure variation
- IVC ultrasound – unfortunately, not really supported by the literature at this point, particularly for patients who are not intubated
- Pulse pressure variation – although this requires an arterial line and has several prerequisites for its use, PPV is a reliable test for fluid responsiveness
- Velocity-time integral and non-invasive cardiac output monitors are the most reliable, but are often beyond the scope of the ED
References
- Rivers E, Nguyen B, Havstad S, Ressler J, Muzzin A KB. Early Goal-Directed Therapy in the Treatment of Severe Sepsis and Septic Shock. N Engl J Med. 2001;345(19):1368-1377.
- Nguyen HB, Jaehne AK, Jayaprakash N, et al. Early goal-directed therapy in severe sepsis and septic shock: Insights and comparisons to ProCESS, ProMISe, and ARISE. Crit Care. 2016;20(1). doi:10.1186/s13054-016-1288-3.
- Mouncey PR, Osborn TM, Power GS, et al. Trial of early, goal-directed resuscitation for septic shock. N Engl J Med. 2015;372:1301-1311. doi:10.1056/NEJMoa1500896.
- PROCESS Investigators. A Randomized Trial of Protocol-Based Care for Early Septic Shock. N Engl J Med. 2014;370(18):1-11. doi:10.1056/NEJMoa1401602.
- ARISE Investigators, ANZICS Clinical Trials Group. Goal-directed resuscitation for patients with early septic shock. N Engl J Med. 2014;371(16):1496-1506. doi:10.1056/NEJMoa1404380.
- Kumar A, Ellis P, Arabi Y, et al. Initiation of inappropriate antimicrobial therapy results in a fivefold reduction of survival in human septic shock. Chest. 2009;136(5):1237-1248. doi:10.1378/chest.09-0087.
- Seymour CW, Gesten F, Prescott HC, et al. Time to Treatment and Mortality during Mandated Emergency Care for Sepsis. N Engl J Med. 2017;376(23):2235-2244. doi:10.1056/NEJMoa1703058.
- Maitland K, Kiguli S, Opoka RO, Engoru C, Gibb DM, Olupot-Olupot P. Mortality After Fluid Bolus in African Children with Severe Infection. N Engl J Med. 2011;364(26):2483-2493. doi:10.1056/NEJMoa1705971.
- Andrews B, Semler MW, Muchemwa L, et al. Effect of an Early Resuscitation Protocol on In-hospital Mortality Among Adults With Sepsis and Hypotension: A Randomized Clinical Trial. JAMA. 2017;318(13):1233-1240. doi:10.1001/jama.2017.10913.
- Hjortrup PB, Haase N, Bundgaard H, et al. Restricting volumes of resuscitation fluid in adults with septic shock after initial management: the CLASSIC randomised, parallel-group, multicentre feasibility trial. Intensive Care Med. 2016;42(11):1695-1705. doi:10.1007/s00134-016-4500-7.
- Macdonald SPJ, Taylor DM, Keijzers G, et al. REstricted Fluid REsuscitation in Sepsis-associated Hypotension (REFRESH): study protocol for a pilot randomised controlled trial. Trials. 2017;18(1):399. doi:10.1186/s13063-017-2137-7.
- Leach RM, Treacher DF. The pulmonary physician in critical care · 2: Oxygen delivery and consumption in the critically ill. Thorax. 2002;57(2):170-177. doi:10.1136/thorax.57.2.170.
- Dunn JOC, Mythen MG, Grocott MP. Physiology of oxygen transport. BJA Educ. 2016;16(10):341-348. doi:10.1093/bjaed/mkw012.
- Bentzer P, Griesdale DE, Boyd J, MacLean K, Sirounis D, Ayas NT. Will This Hemodynamically Unstable Patient Respond to a Bolus of Intravenous Fluids? JAMA J Am Med Assoc. 2016;316(12):1298. doi:10.1001/jama.2016.12310.
- Marik PE. Techniques for Assessment of Intravascular Volume in Critically Ill Patients. J Intensive Care Med. 2009;24(5):329-337. doi:10.1177/0885066609340640.
- Kelm DJ, Perrin JT, Cartin-ceba R, Gajic O, Schenck L, Kennedy CC. Fluid overload in patients with severe sepsis and septic shock treated with early goal directed therapy is associated with increased acute need for fluid-related medical interventions and hospital death. Shock. 2015;43(1):68-73. doi:10.1097/SHK.0000000000000268.Fluid.
- Lung and BIARDCTNTNH. Comparison of Two Fluid-Management Strategies in Acute Lung Injury. N Engl J Med. 2006;354(24):2564-2575. doi:10.1056/NEJMoa062200.
- Sakr Y, Rubatto Birri PN, Kotfis K, et al. Higher Fluid Balance Increases the Risk of Death From Sepsis. Crit Care Med. 2017;45(3):386-394. doi:10.1097/CCM.0000000000002189.
- Smith SH, Perner A. Higher versus lower fluid volume for septic shock : clinical characteristics and outcome in unselected patients in a prospective , multicenter cohort. Crit Care. 2012;16(3):R76. doi:10.1186/cc11333.
- Payen D, de Pont AC, Sakr Y, Spies C, Reinhart K, Vincent JL. A positive fluid balance is associated with a worse outcome in patients with acute renal failure. Crit Care. 2008;12(3):1-7. doi:10.1186/cc6916.
- Surviving Sepsis Campaign. Surviving Sepsis Campaign Updated Bundle. 2015;372(1):1301-1311. doi:10.1056/NEJMoa1500896.
- Levy MM, Evans LE, Rhodes A. The surviving sepsis campaign bundle: 2018 update. Crit Care Med. 2018;46(6):997-1000. doi:10.1097/CCM.0000000000003119.
- Mallat J, Meddour M, Durville E, et al. Decrease in pulse pressure and stroke volume variations after mini-fluid challenge accurately predicts fluid responsiveness. Br J Anaesth. 2015;115(3):449-456. doi:10.1093/bja/aev222.
- Monnet X, Teboul J-L. Passive leg raising: five rules, not a drop of fluid! Crit Care. 2015;19(1):18. doi:10.1186/s13054-014-0708-5.
- Pickett J, Bridges E, Kritek PA, Whitney JD. Passive Leg-Raising and Prediction of Fluid Responsiveness: Systematic Review. Crit Care Nurse. 2017;37(2):32-49.
- Boulain T, Achard J-M, Teboul J-L, Richard C, Perrotin D, Ginies G. Changes in BP Induced by Passive Leg Raising Predict Response to Fluid Loading in Critically Ill Patients. Chest. 2002;121(4):1245-1252.
- Pickett JD, Bridges E, Kritek PA, Whitney JD. Noninvasive blood pressure monitoring and prediction of fluid responsiveness to passive leg raising. Am J Crit Care. 2018;27(3):228-237.
- Lee CWC, Kory PD, Arntfield RT. Development of a fluid resuscitation protocol using inferior vena cava and lung ultrasound. J Crit Care. 2016;31(1):96-100. doi:10.1016/j.jcrc.2015.09.016.
- Vieillard-Baron A, Evrard B, Repessé X, et al. Limited value of end-expiratory inferior vena cava diameter to predict fluid responsiveness impact of intra-abdominal pressure. Intensive Care Med. 2018;44(2):197-203. doi:10.1007/s00134-018-5067-2.
- Dipti A, Soucy Z, Surana A, Chandra S. Role of inferior vena cava diameter in assessment of volume status: A meta-analysis. Am J Emerg Med. 2012;30(8):1414-1419.e1. doi:10.1016/j.ajem.2011.10.017.
- Corl K, Napoli AM, Gardiner F. Bedside sonographic measurement of the inferior vena cava caval index is a poor predictor of fluid responsiveness in emergency department patients. Emerg Med Australas. 2012;24(5):534-539. doi:10.1111/j.1742-6723.2012.01596.x.
- Orso D, Paoli I, Piani T, Cilenti FL, Cristiani L, Guglielmo N. Accuracy of Ultrasonographic Measurements of Inferior Vena Cava to Determine Fluid Responsiveness: A Systematic Review and Meta-Analysis. J Intensive Care Med. 2018:1-10. doi:10.1177/0885066617752308.
- Yang X, Du B. Does pulse pressure variation predict fluid responsiveness in critically ill patients: A systematic review and meta-analysis. Crit Care. 2014;18(6):1-13. doi:10.1186/s13054-014-0650-6.
- Marik PE, Cavallazzi R, Vasu T, Hirani A. Dynamic changes in arterial waveform derived variables and fluid responsiveness in mechanically ventilated patients: A systematic review of the literature. Crit Care Med. 2009;37(9):2642-2647. doi:10.1097/CCM.0b013e3181a590da.
- Perel A. The physiological basis of arterial pressure variation during positive-pressure ventilation. Reanimation. 2005;14(3):162-171. doi:10.1016/j.reaurg.2005.02.002.